
Sports Data and Analytics: Building Sustainable Sporting Ecosystems in India

Why Talent Alone Isn’t Enough
India has never lacked sporting talent. Every year, thousands of young athletes emerge from schools, academies, district tournaments and local competitions with the potential to excel. Yet only a fraction progress to the national or international stage. The challenge is often not talent, but visibility.
For decades, the sporting ecosystem has relied heavily on observation, reputation and limited exposure to identify opportunities for investment and growth. While elite sporting events enjoy extensive coverage, sponsorship and performance analytics, grassroots sports frequently operate outside the spotlight.
As a result, stakeholders often struggle to answer fundamental questions:
-
Which sports are gaining traction?
-
Which regions are producing emerging talent?
-
Where is audience interest growing?
-
Which competitions are attracting fan engagement?
Uncertainty Stalls Investment in Sports
Without reliable answers, investment decisions become difficult. Sponsors seek evidence of audience potential, broadcasters look for signals of growing interest, federations need direction for resource allocation, and policymakers require measurable indicators of impact. In the absence of data, many promising opportunities remain undiscovered.
This is where analytics is beginning to transform the sporting landscape. Today, data extends far beyond match statistics and player performance. It includes audience behaviour, media consumption patterns, sponsor visibility, fan engagement and regional interest trends.
Together, these indicators provide a clearer understanding of how sports ecosystems evolve and where future opportunities lie.
Data: The Missing Link
In many ways, data is becoming the connective tissue between participation and prosperity. It helps convert isolated sporting activity into measurable momentum, enabling stakeholders to identify growth opportunities, allocate resources effectively and build sustainable pathways for sporting excellence.
As sports continue to compete for attention, investment and fan loyalty, the ability to measure and understand their impact may prove just as important as performance on the field itself.
The Numbers Don’t Lie
Sports advertising volumes have grown by 10.6% over the last three years, as shown below:
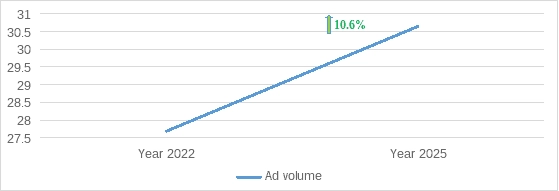
Figure 1: Sports advertising volumes grew from 27.68 million ad units in 2022 to 30.63 million in 2025.
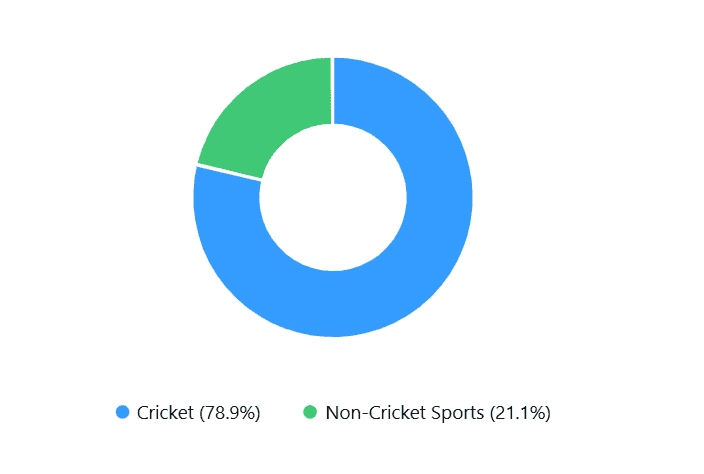
Figure 2: For every 100 sports advertisements aired in India, approximately 79 (volume) appear during cricket programming and only 21 across all other sports combined.
Cricket Advertising – 24.17 Mn
Non-cricket Advertising – 6.46 Mn
Total Sports Advertising – 30.63 Mn
| Program Genre | Ad Duration (Hours) | % Share |
|---|---|---|
| Cricket | 2,671.80 | 82.72% |
| Kabaddi | 133.35 | 4.13% |
| Tennis | 130.77 | 4.05% |
| Soccer | 123.03 | 3.81% |
| Other Sports | 42.32 | 1.31% |
| Volleyball | 42.15 | 1.31% |
| Mixed Martial Arts | 16.25 | 0.50% |
| Car / Bike Racing | 12.17 | 0.38% |
| Wrestling | 10.40 | 0.32% |
| Rugby/Football | 9.41 | 0.29% |
| Table Tennis | 8.49 | 0.26% |
| Badminton | 7.78 | 0.24% |
| Multi Sports Events (Olympics) | 6.66 | 0.21% |
| Hockey | 6.22 | 0.19% |
| Golf | 4.65 | 0.14% |
| Basketball | 2.03 | 0.06% |
| Boxing | 1.51 | 0.05% |
| Athletics | 1.00 | 0.03% |
| Total | 3,230 | 100% |
Table 1: Across all sports programming, advertisers aired approximately 3,230 hours of advertising, with Cricket alone accounting for 2,672 hours, or nearly 83% of all sports ad airtime.
Data is No Longer Just About Performance
For much of the sporting world’s history, analytics was largely confined to the field of play. Coaches and teams relied on performance metrics to evaluate athletes, refine strategies and gain a competitive edge.
Statistics such as scoring rates, strike rates, passing accuracy or win/loss records became integral to decision making at the highest levels of sport. While performance analytics remains critical, the role of data in sports has expanded significantly.
Today, the success of a sporting ecosystem depends not only on what happens on the field, but also on how that sport connects with audiences beyond it. Stakeholders are increasingly seeking answers to questions that extend past the competition.
-
Who is watching?
-
How are fans engaging with content?
-
Which regions are showing growing interest?
-
What level of exposure are sponsors receiving?
-
Which sporting properties are generating sustained attention over time?
The ability to answer these questions is becoming increasingly important in a highly competitive sports landscape where audience attention, sponsorship investments and media visibility often determine the pace of growth.
Match Stats to Audience Insights: What’s Being Measured Now
Audience measurement and engagement analytics now offer valuable insights into fan behaviour across platforms. Media monitoring helps quantify visibility and understand how different sports, leagues and athletes are being represented. Sponsorship analytics provides a clearer view of brand exposure and return on investment, while regional consumption patterns help identify emerging markets and untapped opportunities.
Collectively, these insights allow stakeholders to move from intuition led decisions to evidence based strategies. Investments can be directed towards sports with growing audiences, regions demonstrating increased participation, or properties showing strong commercial potential.
In this evolving environment, measurement is no longer simply a reporting tool. It is becoming a strategic enabler, helping federations, sponsors, broadcasters and sports organizations identify opportunities, optimize investments and build sustainable pathways for long term growth.
How Regional Leagues Are Winning Advertiser Attention
Did you know?
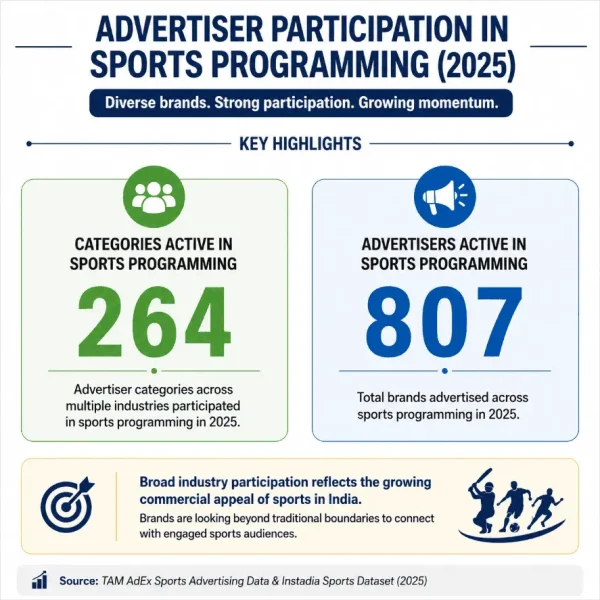
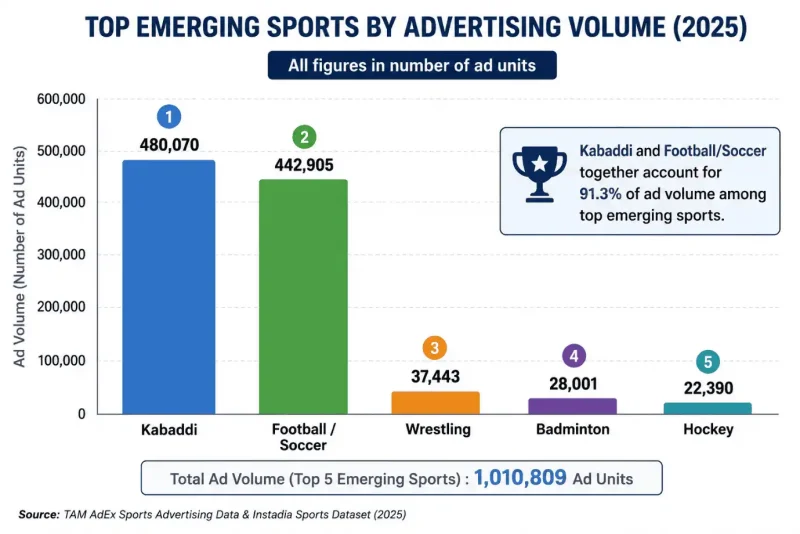
Figure 3: The increasing diversity of advertisers across sports properties suggests that commercial interest is no longer confined to marquee events alone. As audience measurement becomes more sophisticated, brands can identify opportunities across a broader sporting landscape.
Grassroots development succeeds when investment follows audience interest rather than assumptions. Regional leagues are increasingly attracting advertisers such as local banks, educational institutions, real estate developers, FMCG brands, and retail chains.
The advertiser appeal of these tournaments is evident from the strong audience traction they generate. For instance, the Maharashtra Premier League reportedly delivered a viewership of nearly 170 million last season, highlighting the growing potential of regional sporting properties.
More recently, state level leagues such as the Tamil Nadu Premier League, Maharashtra Premier League, and Bengal Pro T20 League have also begun attracting national advertisers seeking deeper audience engagement and stronger market connect within key regional geographies.
The Investment Multiplier Effect
One of the most significant contributions of data to the sports ecosystem is its ability to reduce uncertainty. Every stakeholder in the sporting value chain is tasked with making investment decisions, whether those investments involve funding, infrastructure, media coverage, sponsorship, talent development or policy support. The quality of these decisions often depends on the quality of available information.
Sponsors
For sponsors, data helps identify emerging opportunities before they become mainstream. Understanding their brand match with a particular sport, audience profiles, engagement levels and visibility trends enables brands to align with sporting properties that resonate with their target consumers and deliver measurable value.
Sports Federations and Governing Bodies
For sports federations and governing bodies, analytics can highlight regions demonstrating strong participation or growing interest in specific disciplines. Such insights help prioritise development programs, coaching initiatives and infrastructure investments where they can create the greatest impact.
Broadcasters and Media Platforms
Broadcasters and media platforms face the challenge of determining which sporting properties deserve greater visibility. Audience measurement and consumption trends provide objective indicators of fan interest, helping shape programming strategies and uncover opportunities beyond established marquee events.
League and Tournament Organisers
Leagues and tournament organisers increasingly rely on fan engagement metrics to understand what attracts audiences and sustains interest over time. From scheduling decisions to content strategies to audit of the commercial airing, data offers a clearer view of how fans, stakeholders interact with sports across platforms.
Government Bodies and Policymakers
For policymakers and government bodies, measurement can provide valuable signals on the growth trajectory of different sports. Participation levels, audience interest and media visibility can all contribute to more informed decisions regarding funding, infrastructure and grassroots development.
When viewed collectively, these insights create a multiplier effect across the ecosystem. Better measurement leads to better decisions. Better decisions lead to more efficient investments. More efficient investments create stronger sporting structures, wider participation and greater opportunities for athletes to progress through the development pathway.
In this sense, data does more than measure growth. It actively contributes to creating the conditions that make growth possible.
Visibility Creates Momentum
The journey from grassroots participation to sporting excellence is rarely linear. It is often driven by a cycle of visibility, investment and growth, with data acting as the catalyst that keeps the cycle moving.

Figure 4: This cycle illustrates how data can influence outcomes far beyond measurement alone. By making visibility tangible, analytics helps unlock investment, expand reach and strengthen the foundations upon which sporting excellence is built. In this way, data becomes more than a reporting mechanism; it becomes an enabler of sustainable ecosystem growth.
1. Evidence-based Understanding
When a sport begins to receive measurable visibility, the first outcome is understanding. Stakeholders gain a clearer picture of audience reach, fan interest and levels of engagement. What may once have been perceived as a niche or emerging sport can now be evaluated through objective evidence rather than anecdotal observations.
2. Increasing Sponsor Confidence
As audience interest becomes measurable, sponsor confidence tends to increase. Brands are more willing to associate with sporting properties when they can assess visibility, engagement and potential returns with greater certainty. This infusion of commercial support often provides additional resources for competitions, athlete development programs and promotional activities.
3. Increased Media Attention
Greater investment frequently leads to increased media attention. As sporting properties attract advertisers and audiences, broadcasters and content platforms are encouraged to provide wider coverage, helping the sport reach new audiences and communities.
4. Increased Participation
Enhanced visibility can, in turn, stimulate participation. Young athletes are inspired by increased exposure, local competitions gain recognition and pathways to higher levels of competition become more apparent. The given sport now begins to attract not only spectators but also future participants.
5. Larger Talent Pool
Over time, a broader participation base creates a larger talent pool. With improved infrastructure, greater support and stronger developmental pathways, more athletes can have the opportunity to progress and excel.
The Road Ahead: Measurable Growth Over Assumed Potential
The sports industry is entering an era where intuition alone is no longer enough. Decisions around investment, development and growth increasingly require evidence, insight and accountability. The sports that thrive in the coming decade may not necessarily be those with the largest audiences today, but those that can best demonstrate their potential through measurable engagement, sustainable growth and long term impact.
It is often said that “it takes a village to raise an athlete.” As the ecosystem evolves, data will become more than a record of success. It will be one of the key drivers helping create it.
Key Takeaways:
● For every 100 sports ads aired in India, nearly 79 appear during cricket programming.
● Cricket attracts 3.7 times more advertising inventory than all non-cricket sports combined.
● Despite accounting for just 21% of sports inventory, non-cricket sports engage 264 advertiser categories.
● Kabaddi has nearly doubled its advertiser category participation in just three years.
Emerging sports are gaining advertisers, but cricket still delivers 24 times more advertising inventory.